BEV Ready · Case studies
Six depots, re-modeled against the published record.
Each of these is a real, published transit electrification study — re-built end-to-end in the depot digital twin and run against its own worst plausible day, then compared to what the original researchers found. Every number below traces to a source you can read yourself.
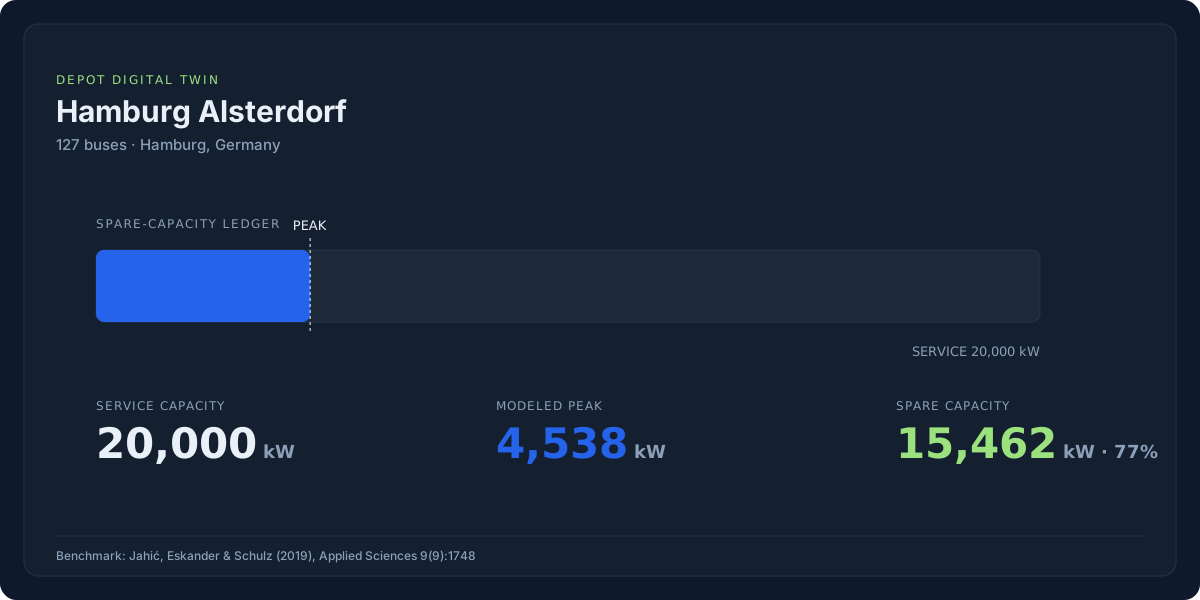 Hamburg Alsterdorf Depot — Finding the Real Peak Behind a 127-Bus Fleet
4,538 kW
Modeled winter peak: 4,538 kW, 3× headroom on a 20 MW service
Read the reconstruction →
Hamburg Alsterdorf Depot — Finding the Real Peak Behind a 127-Bus Fleet
4,538 kW
Modeled winter peak: 4,538 kW, 3× headroom on a 20 MW service
Read the reconstruction →
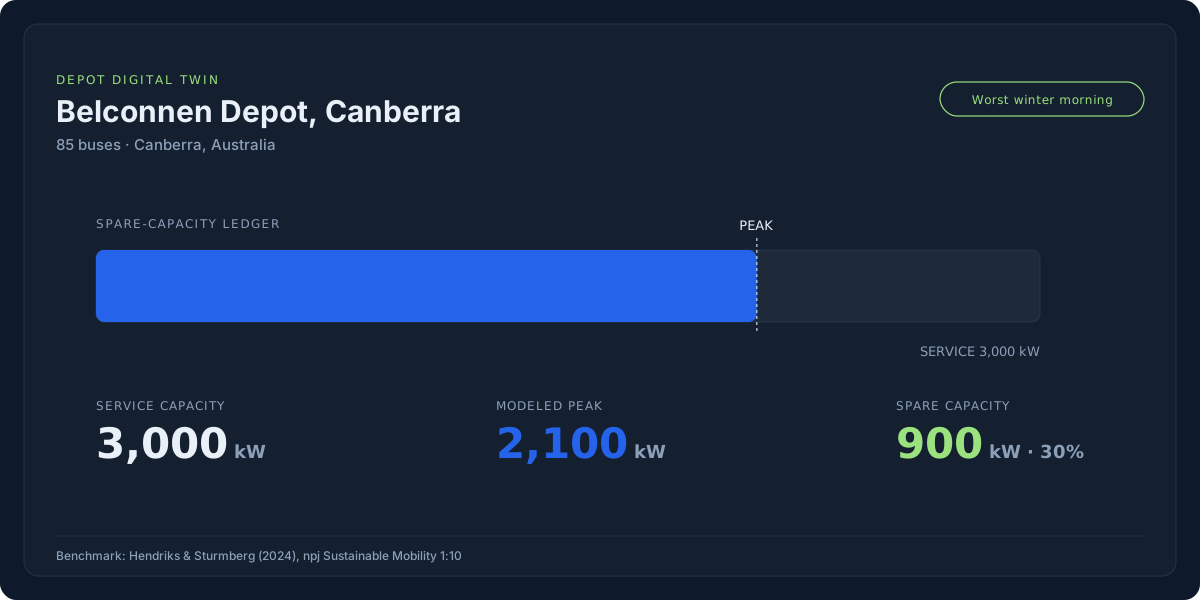 Belconnen Depot, Canberra — Proving a Fleet Fits Before Committing to Grid Upgrades
900 kW
900 kW spare capacity confirmed on the coldest winter morning
Read the reconstruction →
Belconnen Depot, Canberra — Proving a Fleet Fits Before Committing to Grid Upgrades
900 kW
900 kW spare capacity confirmed on the coldest winter morning
Read the reconstruction →
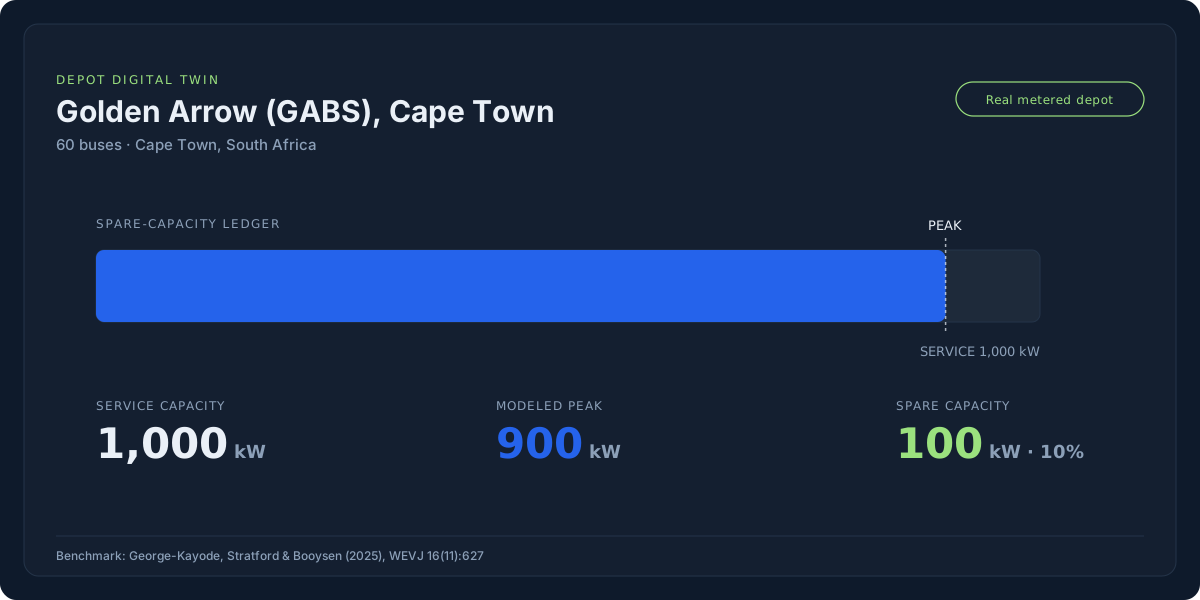 Golden Arrow Bus Services, Cape Town — Turning a Demand-Charge Constraint into an Operating Strategy
900 kW
Modeled peak matched the real depot's charger-cap strategy exactly
Read the reconstruction →
Golden Arrow Bus Services, Cape Town — Turning a Demand-Charge Constraint into an Operating Strategy
900 kW
Modeled peak matched the real depot's charger-cap strategy exactly
Read the reconstruction →
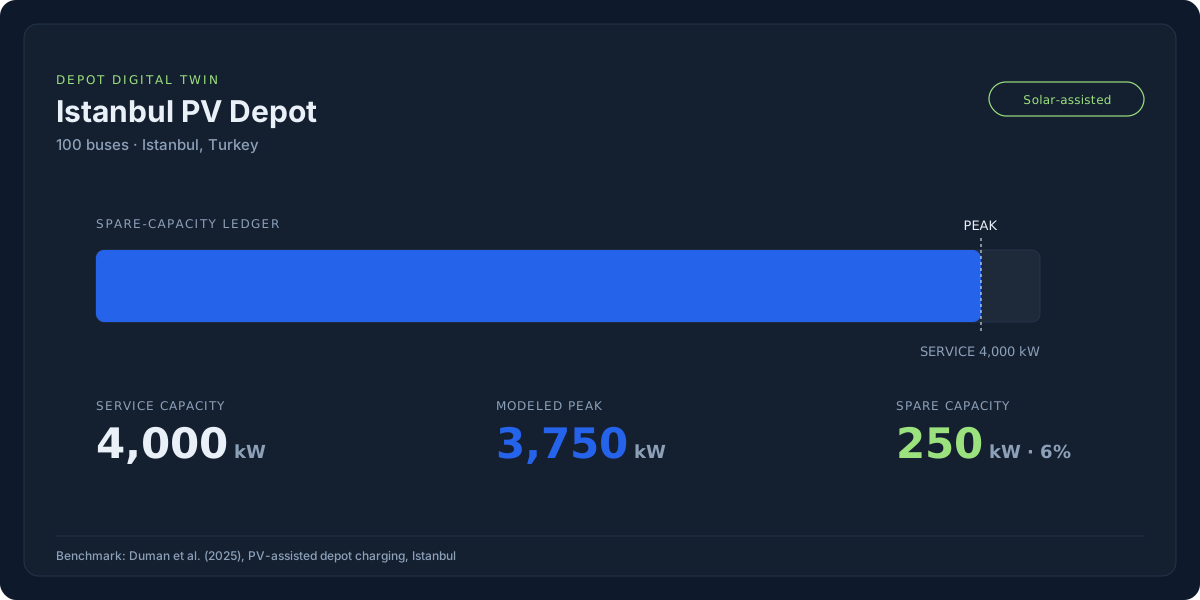 Istanbul PV Depot — Cutting a Charging Peak 40% Without Touching a Single Charger
−40%
Charge-schedule optimizer cut peak 40% at zero infrastructure cost
Read the reconstruction →
Istanbul PV Depot — Cutting a Charging Peak 40% Without Touching a Single Charger
−40%
Charge-schedule optimizer cut peak 40% at zero infrastructure cost
Read the reconstruction →
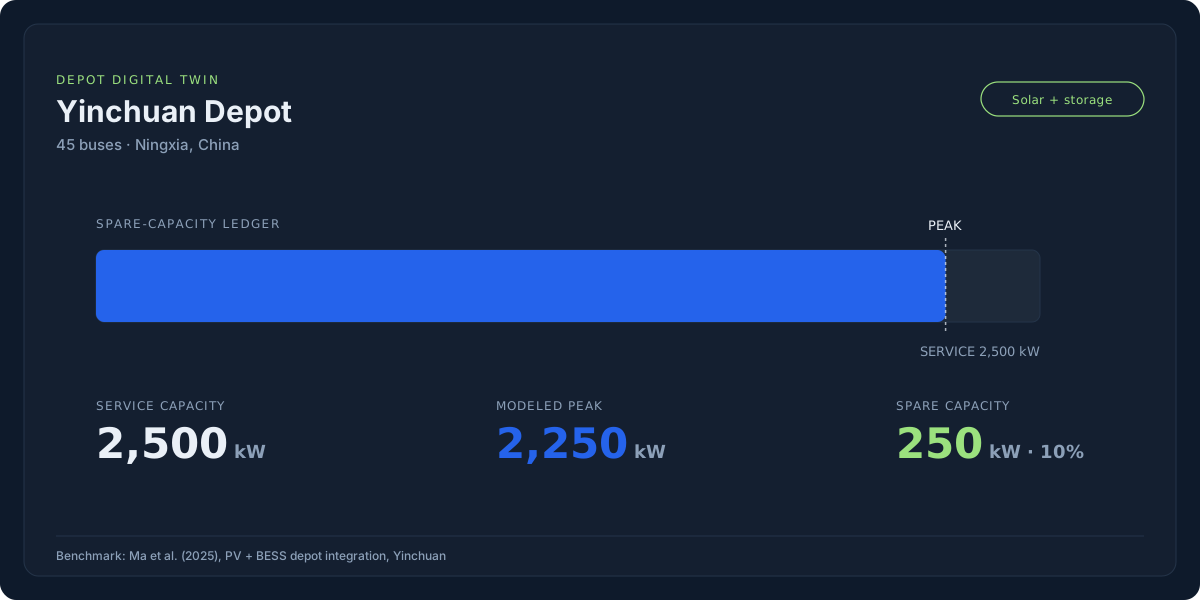 Yinchuan Depot — Modeling Solar and Storage Together at a Single-Depot Scale
2,250 kW
Solar + storage validated at mid-sized depot scale
Read the reconstruction →
Yinchuan Depot — Modeling Solar and Storage Together at a Single-Depot Scale
2,250 kW
Solar + storage validated at mid-sized depot scale
Read the reconstruction →
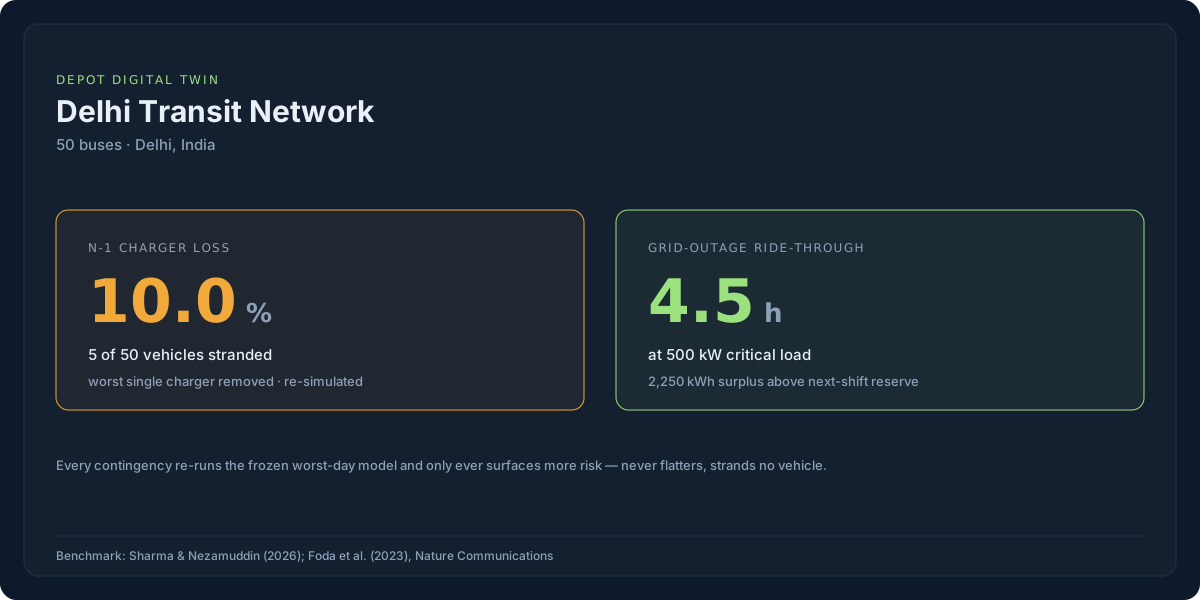 Delhi Transit Network — Answering "What If a Charger Fails?" Before It Happens
4.5 hours
Quantified charger-failure impact and 4.5-hour outage ride-through
Read the reconstruction →
Delhi Transit Network — Answering "What If a Charger Fails?" Before It Happens
4.5 hours
Quantified charger-failure impact and 4.5-hour outage ride-through
Read the reconstruction →
Get notified when new reconstructions are published
We add a new depot reconstruction as each one is validated. No other email.
You're on the list — we'll email you when the next reconstruction goes live.