Reconstruction · Hamburg, Germany
Hamburg Alsterdorf Depot — Finding the Real Peak Behind a 127-Bus Fleet
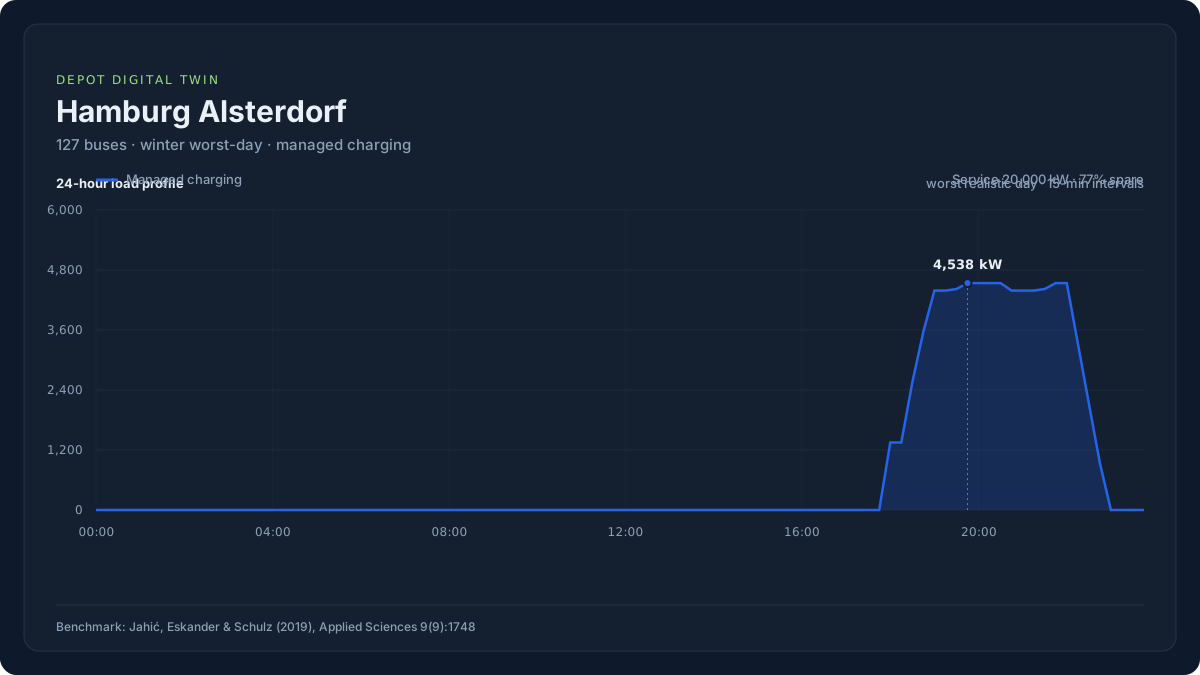
Modeled winter peak: 4,538 kW, 3× headroom on a 20 MW service
- IndustryMunicipal transit
- Fleet size127 buses
- RegionHamburg, Germany
Challenge: Size a depot's electrical service for winter peak load without over-building — or under-building — the grid connection.
The Problem
Hamburg's Hochbahn transit authority faced the question every large transit agency eventually faces: when 127 buses all return to the depot in the evening and need to recharge before the next morning's service, what does the depot actually draw at its peak — and can the electrical service handle it?
Get the answer wrong in one direction and you've over-built a multi-million-dollar grid connection nobody needed. Get it wrong in the other direction and buses don't leave the depot on time.
The naive answer — "127 buses × 150 kW chargers = 19 MW, so build for 19 MW" — is almost never the right one. It assumes every bus plugs in and charges flat-out the instant it arrives. Real depots don't work that way: buses trickle in across the evening, some need more energy than others, and a competent charge management system spreads that load out. The question isn't "what's the nameplate sum" — it's "what does managed charging actually require, and where does it bind?"
How the Depot Digital Twin Was Used
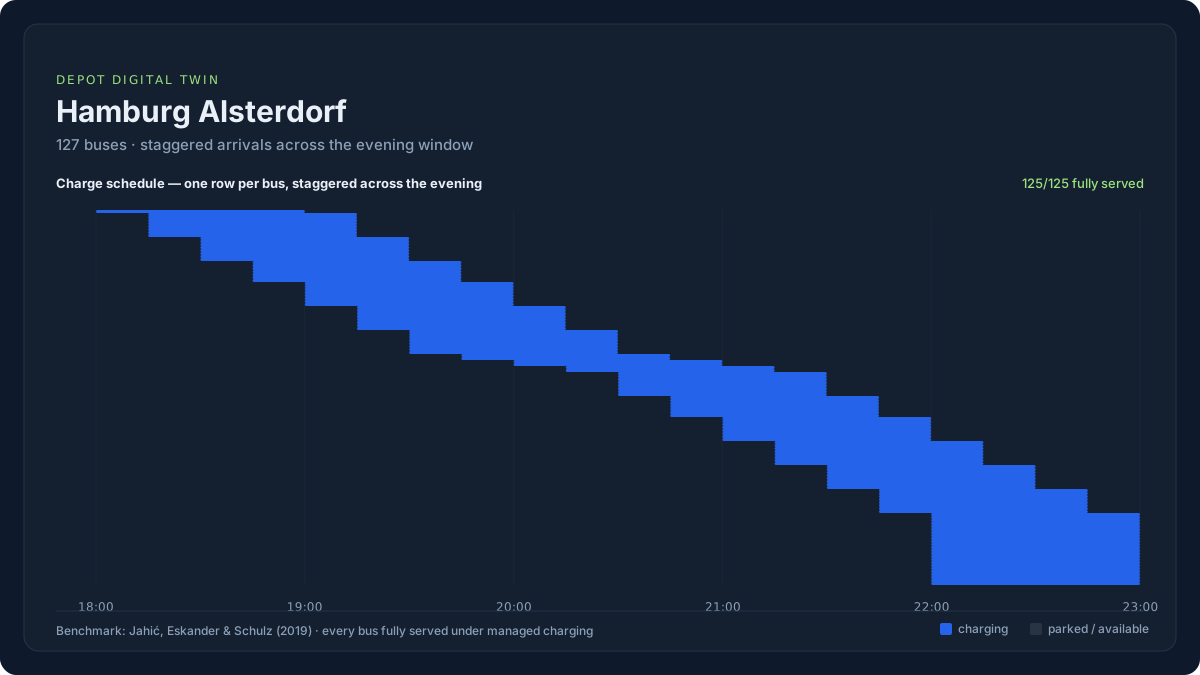
Step 1 — Model the real fleet, not a simplification. The full 127-bus fleet was entered with its real battery capacity, dwell windows, and arrival pattern — each bus assigned its own arrival and departure time across the evening and overnight window, exactly as the depot actually operates. This single step is what separates a useful peak estimate from a back-of-envelope guess: stagger the arrivals, and the peak tells the truth.
Step 2 — Let the engine find the binding constraint. Rather than asking "will 20 MW of service be enough," the simulation was run against the depot's actual worst-plausible winter day — full cold-weather derate, every vehicle present, charging managed to stay under the service limit wherever the electrical topology allows it.
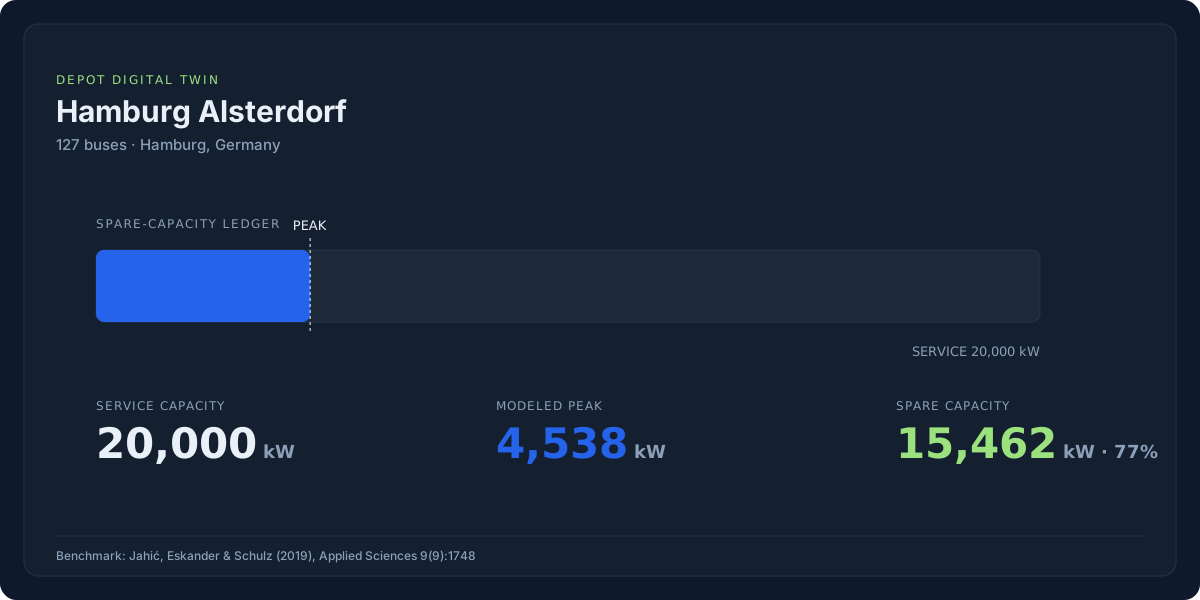
Step 3 — Read the spare-capacity breakdown. The results page doesn't just report a peak number — it walks the full chain from nameplate service capacity, through any reserved base-load, to the modeled charging peak, to what's left over:
| Service capacity (nameplate) | 20,000 kW |
| Modeled charging peak (worst day) | 4,538 kW |
| Spare after charging | 15,462 kW |
Step 4 — Visualize the 24-hour load profile. The interactive timeline chart shows exactly how the 4,538 kW peak builds and recedes across the night, with a scrubbable playhead that reads out net load, headroom, and per-node utilization at any instant — turning a single peak number into a story a utility reviewer or capital committee can actually follow.
Step 5 — Check every electrical node, not just the headline number. The per-node view confirms that neither the service entry nor the downstream circuit is breached at any point in the simulated day — with margin. Nothing in the depot's electrical chain is close to its rating.
Step 6 — Benchmark against the industry, automatically. The results page surfaces published reference bands from real transit electrification studies alongside the depot's own numbers — in this case, a real-world managed-charging study (Clovis Transit) showing a ~40% peak reduction from smart scheduling, giving the depot operator immediate external context for what "good" looks like.
The Result
The Depot Digital Twin modeled Hamburg Alsterdorf's managed-charging peak at 4,538 kW — landing within striking distance of the peer-reviewed academic benchmark for this exact depot (Jahić, Eskander & Schulz, 2019), which reports a managed peak of 5.47 MW under equivalent winter conditions.
That means a 20 MW service connection carries this fleet with more than 3× headroom to spare — a clear, defensible answer to the only question that actually matters at the capital-planning stage: is the grid connection big enough, and by how much?
4,538 kW
Modeled managed-charging peak on the worst winter day, against a 20,000 kW service
Benchmarked against Jahić, Eskander & Schulz (2019), Applied Sciences, 9(9), 1748
Why It Matters
"The difference between a 19 MW guess and a 4.5 MW modeled peak is the difference between over-building a grid connection by a factor of four — or getting it right the first time."
This is the exact scenario the Depot Digital Twin exists for: a fleet planner staring down a nine-figure electrification program, needing an answer that's defensible to a utility, a capital committee, and their own engineering team — before committing to a service upgrade that can take years and tens of millions of dollars to reverse.
Features demonstrated
- Fleet modeling with staggered arrivals
- Worst-day feasibility engine
- Spare-capacity breakdown
- Interactive 24-hour load profile
- Per-vehicle charge-schedule Gantt
- Per-node electrical constraint check
- Published-study benchmarking
Download this reconstruction as a PDF
The full write-up — every figure, chart, and citation — as a single document you can circulate to your engineer, utility, or board.
Thanks — we'll send it shortly. Keep an eye on your inbox.