Reconstruction · Canberra, Australia
Belconnen Depot, Canberra — Proving a Fleet Fits Before Committing to Grid Upgrades
900 kW spare capacity confirmed on the coldest winter morning
- IndustryPublic transit
- Fleet size85 buses
- RegionCanberra, Australia
Challenge: Confirm a mid-sized transit depot's electrical service can absorb a full battery-electric conversion through a winter morning peak — the coldest, hardest test of the year.
The Problem
Canberra's transit authority set out to electrify the Belconnen depot's 85-bus fleet and needed a hard answer to a simple-sounding question: on the coldest winter morning, with every bus back at the depot and needing to charge, does the electrical service hold?
Winter matters here in a way summer never does. Cold weather cuts battery range, adds heating load, and compresses the usable charging window — all at once, on exactly the days when transit service can least afford a shortfall. A depot sized on a mild-day estimate is a depot that fails on the one day it actually gets tested.
How the Depot Digital Twin Was Used
Step 1 — Build the fleet against real hardware. All 85 buses were modeled with their actual battery capacity and a fleet of 300 kW DC fast chargers — the exact charging infrastructure spec the depot planned to install — rather than a generic placeholder.
Step 2 — Run the worst-plausible winter day, not an average one. The simulation doesn't ask "what does a typical night look like" — it asks "what does the worst night look like, with every vehicle present and full cold-weather derating applied." That's the day a depot actually has to survive.
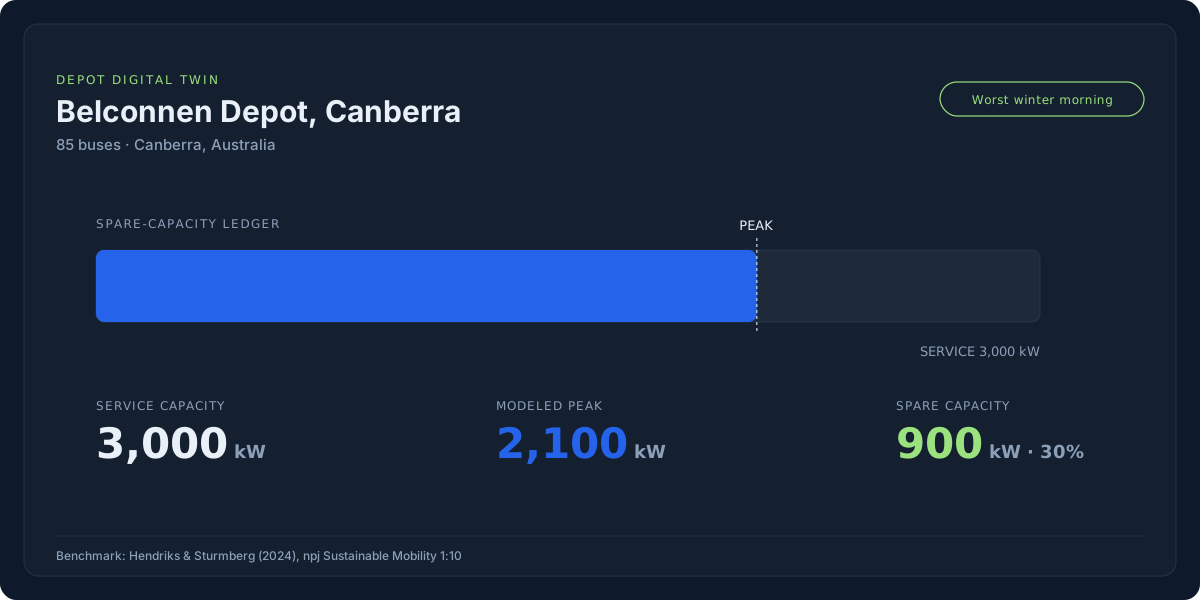
Step 3 — Read the answer straight off the spare-capacity ledger:
| Service capacity (nameplate) | 3,000 kW |
| Modeled charging peak (worst day) | 2,100 kW |
| Spare after charging | 900 kW |
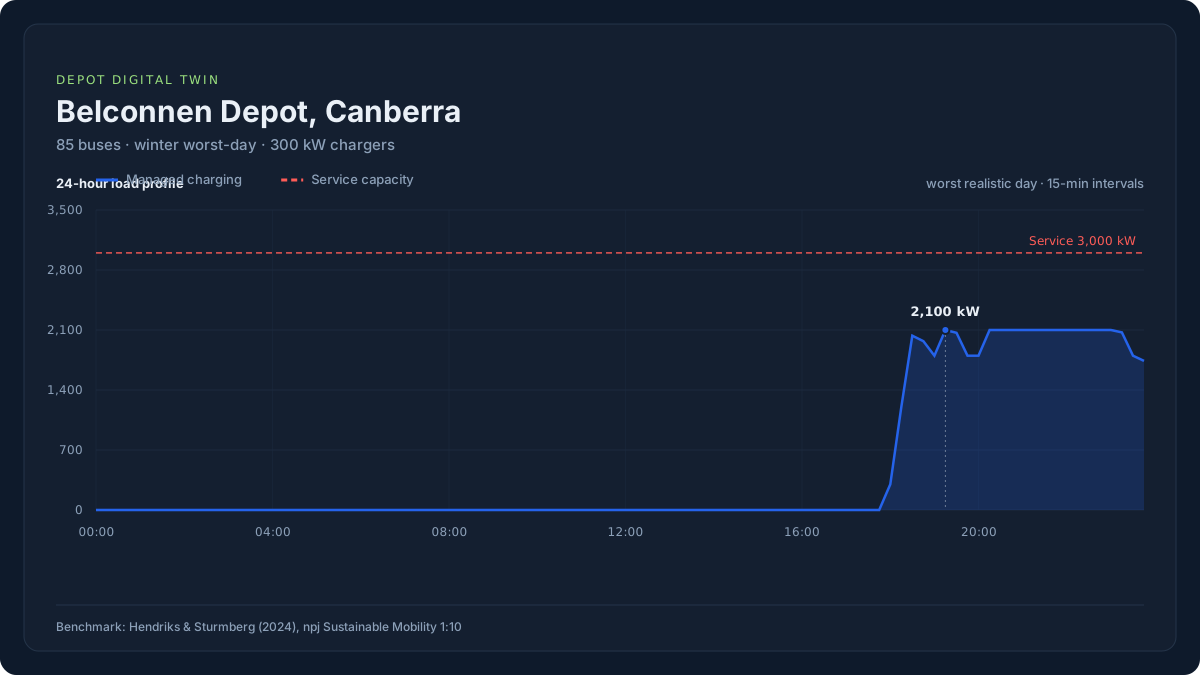
Step 4 — Watch the peak build on the interactive load-profile timeline. The 24-hour chart shows managed charging ramping up as buses return through the evening and tapering as they depart the next morning — with a scrub bar that lets a planner step through the night minute by minute and see exactly how much headroom remains at any point.
Step 5 — Confirm every node in the electrical chain holds. The per-node view checks the service entry and downstream circuit against the modeled peak side by side — both comfortably under their rated capacity, with margin to spare.
Step 6 — Open the storage business case for the next question. With headroom already confirmed, the Storage module is where Belconnen's planners go next: modeling whether an on-site battery could bank even more margin against future fleet growth, priced against a directional demand-charge rate — a "what if we grow" lever sitting one click away from "are we safe today."
The Result
The Depot Digital Twin modeled Belconnen's managed winter peak at 2,100 kW against a 3,000 kW service — a comfortable 900 kW of spare capacity, confirmed node-by-node across the depot's full electrical chain. The peak lands consistent with the published academic benchmark for this exact depot (Hendriks & Sturmberg, 2024, npj Sustainable Mobility and Transport), which models the same fleet's worst-case morning in the 3 MW range before any load management is applied — validating that Belconnen's charge-management strategy is doing real, measurable work to keep the depot inside its service envelope.
900 kW
Spare capacity after a 2,100 kW modeled peak, against a 3,000 kW service
Benchmarked against Hendriks & Sturmberg (2024), npj Sustainable Mobility and Transport, 1, 10
Why It Matters
"900 kW of spare capacity on the coldest morning of the year is the number that lets a transit authority sign off on an 85-bus conversion with confidence — not hope."
For a public transit authority answering to a city council and a ratepayer base, that's not just a planning number — it's the evidence that turns an electrification proposal into an approved capital project.
Features demonstrated
- Real-hardware charger modeling
- Worst-plausible-day winter simulation
- Spare-capacity ledger
- Interactive 24-hour load profile
- Per-node capacity check
- Storage business case module
Download this reconstruction as a PDF
The full write-up — every figure, chart, and citation — as a single document you can circulate to your engineer, utility, or board.
Thanks — we'll send it shortly. Keep an eye on your inbox.